Key figures
- 10.9 mb/dtotal oil flows through the Strait of Hormuz in September 2026, according to the IEA, against a 2025 average of 19.87 mb/d.IEA, via gCaptain; IEA Strait of Hormuz factsheet
- 5.8 millionbarrels a day pumped through Saudi Arabia's East-West pipeline on 6 October, against a maximum of 7 million.Al Jazeera
- 60%share of the region's crude exports that crossed Hormuz in September, against 83% before the war; the rest left via the Gulf of Oman coast and the Red Sea.Kpler
- 509 mbhow far observed global oil stocks stood below pre-war levels at the end of September.IEA, via gCaptain
- 153security incidents in and around the strait confirmed by the Joint Maritime Information Center since 1 March.gCaptain
How much oil is passing through Hormuz now?
Before the war, the strait carried 19.87 million barrels a day (mb/d) of oil in 2025: 14.95 mb/d of crude and condensate and 4.93 mb/d of refined products, about a quarter of world seaborne oil trade [1]. According to the International Energy Agency (IEA), total flows through the strait were 10.9 mb/d in September 2026, up 3.7 mb/d on August, as reported by gCaptain [2]. Kpler counts 9.9 mb/d of confirmed crude crossings in the same month [3]. The two figures measure slightly different things, but both put traffic at roughly half of normal.
The gap is much wider for refined products. Middle East product shipments averaged 1.9 mb/d in September against 4.7 mb/d before the war, and diesel and gasoil exports were about 1.3 mb/d lower than a year earlier [2]. That is why diesel, not crude, has been the tightest part of the market. Vessel traffic is still thin: gCaptain counted 254 transits in the week to 14 October, roughly 70% below pre-war levels [4].
How did Gulf exporters work around the strait?
Crude exports recovered faster than anyone expected in the spring. Kpler says at least 16.5 mb/d of crude left the region between 1 and 28 September, matching the pre-war average excluding Iran [3]. The difference is the route. Before the war 83% of these barrels crossed Hormuz; in September the share was 60%, with 23% loaded on the Gulf of Oman coast, mainly at Fujairah, and 17% shipped from the Red Sea [3].
Two pipelines carry most of the bypass barrels. Saudi Arabia's East-West line to Yanbu was pumping 5.8 million barrels a day on 6 October, Energy Minister Prince Abdulaziz bin Salman said, against a maximum of 7 million; Kpler had put August flows at about 2 mb/d [5]. The line was halted in early September after drone attacks on pumping stations and partially resumed on 22 September [6]. The UAE's Habshan–Fujairah line has a nameplate capacity of 1.5 mb/d, about 1.8 mb/d in practice, and carried about 1.1 mb/d before the war [1]. Fujairah loadings rose from 1.1 mb/d to 2.7 mb/d, a figure that includes barrels moved by shuttle tankers [3].
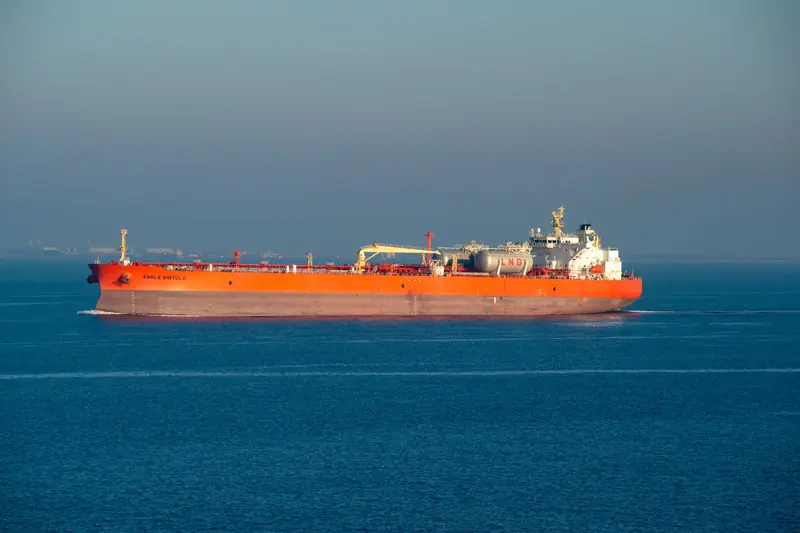
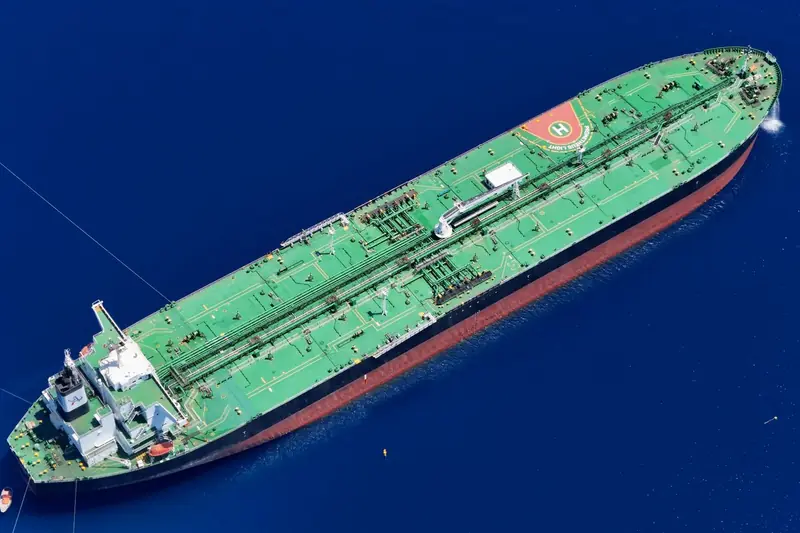
The rest of the recovery comes from a shuttle fleet. Most crude that still crosses the strait is transferred ship to ship off Fujairah or Sohar: 86% in May and more than 70% in August, according to Kpler [3]. Kuwait, Qatar and most of Iraq have no pipeline bypass. Iraq's Basrah exports, which fell to 98,000 b/d in May, recovered to 2.58 mb/d in September and about 2.90 mb/d by mid-October, against a 2025 baseline of 3.34 mb/d [7].
Data
| Basrah exports | |
|---|---|
| May | 0.10 |
| September | 2.58 |
| Mid-October | 2.90 |
What is happening to shipping, insurance and freight?
Moving oil through a contested waterway is expensive. Vortexa counted about 60 very large crude carriers (VLCCs) shuttling through Hormuz in late September, against about 30 in June and July and 7 in April, Enterprise AM reported, citing Bloomberg [8]. VLCC earnings on Middle East–East Asia routes are up more than 4,400% this year according to the Baltic Exchange, and some Gulf voyages have been fixed at up to $40 million [8]. Kpler's Muyu Xu told Bloomberg that more shuttle tankers are unlikely to lower rates materially while the threat of attacks remains [8].
Insurance has moved in the same direction. In July, broker Marsh put war-risk premiums at 3% to 10% of a ship's hull value, against about 0.25% before the conflict; on a $100 million tanker that is $3 million to $10 million per voyage instead of about $250,000 [9]. S&P Global data cited by Al Jazeera put the cost of shipping a tonne of crude from the Gulf to China at $77.96 in late July, against a five-year average of $18.91 and a March peak near $140 [10].
The security picture has not improved. The Joint Maritime Information Center has confirmed 153 incidents since 1 March and keeps the threat level at "severe" [4]. Enterprise AM counted almost 30 Iranian attacks in October, a wartime high [8]. On 30 October the UK Maritime Trade Operations centre reported a limpet-mine attack on a tanker off Khasab, while Iran's Revolutionary Guard said several tankers had hit mines on what it calls an "unauthorised" southern route; the US Central Command says the main lanes have been cleared [11].
What has the disruption done to prices?
Brent was about $72 a barrel on 1 July, before the second closure, and rose back above $100 within three weeks [12]. The US Energy Information Administration (EIA) says spot Brent reached $131 on 15 September, after the attack on the East-West pipeline, and averaged $114 in September [6]. In October the December futures contract settled at $114.88 on 29 October [13].
Data
| Brent | |
|---|---|
| 1 Jul (spot) | 72.00 |
| Sep avg (spot) | 114.00 |
| 15 Sep (spot peak) | 131.00 |
| 5 Oct | 102.31 |
| 29 Oct (Dec futures) | 114.88 |
Regional grades show the cost of seaborne risk. On 5 October, Gulf News reported Abu Dhabi's Murban at $110 a barrel against Brent near $102, a gap it attributed to freight and insurance [14]. Products are under more strain than crude: the IEA said diesel benchmarks set records above $200 a barrel in September [15].
Gas markets are exposed too. About 20% of global LNG trade passed through Hormuz in 2025, and 93% of Qatar's LNG exports used the strait [1]. QatarEnergy has extended its force majeure to the end of December, and about 17% of its LNG capacity was knocked out by an Iranian strike, The National reports [16].
What do forecasters assume next?
The EIA's October outlook assumes Middle East flows stay constrained through the fourth quarter. It estimates crude shut-ins at 10.9 mb/d at the May peak, 5.8 mb/d in August and 4.8 mb/d in September, and assumes 4.5 mb/d for the fourth quarter, with most regional output back to pre-conflict levels by the end of the second quarter of 2027 [6]. Its Brent forecast is $105 for the fourth quarter of 2026 and $83.74 on average in 2027 [17].
The IEA expects the oil market to stay in deficit through the end of 2026, with observed stocks already 509 million barrels below pre-war levels at the end of September [2]. Member countries have released about 330 million barrels from emergency stocks and agreed on 15 October to speed up the remaining 100 million or so, including more than 20 million barrels of diesel [18].
New pipe will take time. Kpler says a new 300 km UAE line could raise the country's bypass capacity from about 1.8 mb/d to 3.6 mb/d, with a material effect from mid-2027, while an expansion of the East-West line would be feasible from 2028 [19]. Aramco chief executive Amin Nasser has said the system "is already straining" and that rebuilding inventories could take up to two years [20].
What to watch
- Diplomacy. Qatari mediators returned to Tehran on 30 October and Iran is expected to answer a revised US proposal [11]. Tamas Varga of PVM told Al Jazeera that only a credible US–Iran agreement would normalise flows [20].
- Attacks on bypass routes. The September strike on the East-West line showed that the workarounds are also targets [5,6].
- Freight and insurance. Rates are likely to stay high while attacks on shipping continue [8].
- LNG. QatarEnergy says undamaged facilities could restart within about a week of a peace deal, but two damaged trains need years of repair [16].
Alupetra follows crude, product and freight markets daily; our Brent and WTI price pages and crack spread calculator are updated every morning.
Sources
- IEA — Strait of Hormuz factsheet (February 2026). iea.blob.core.windows.net (opens in a new tab)
- gCaptain — IEA moves to accelerate oil reserve releases as Hormuz crisis drags on (16 October 2026). gcaptain.com (opens in a new tab)
- Kpler — Explainer: how Mideast Gulf crude exports returned to pre-war levels (October 2026). kpler.com (opens in a new tab)
- gCaptain — Iran claims more tankers hit mines in Hormuz, but evidence remains elusive (20 October 2026). gcaptain.com (opens in a new tab)
- Al Jazeera — Saudi Arabia says East-West pipeline pumping 5.8 million bpd (6 October 2026). aljazeera.com (opens in a new tab)
- EIA — Short-Term Energy Outlook: global oil markets (6 October 2026). eia.gov (opens in a new tab)
- Kpler — Iraqi Basrah crude exports rebound toward 3.00 mb/d in October (October 2026). kpler.com (opens in a new tab)
- Enterprise AM (Bloomberg) — Former dark-fleet tankers are moving Iraqi crude through Hormuz as freight rates hit records (29 October 2026). enterpriseam.com (opens in a new tab)
- The National — War-risk shipping premium surges again as tensions escalate at Strait of Hormuz (17 July 2026). thenationalnews.com (opens in a new tab)
- Al Jazeera — How shipping insurance rates are rising as Hormuz, Bab al-Mandeb shut down (23 July 2026). aljazeera.com (opens in a new tab)
- Euronews — Iran's Revolutionary Guard reports tankers on fire in Strait of Hormuz as talks continue (30 October 2026). euronews.com (opens in a new tab)
- EIA — Today in Energy: crude oil prices and refinery margins increased through the third quarter (5 October 2026). eia.gov (opens in a new tab)
- Rigzone — Oil wavers on conflicting reports of USA military moves (29 October 2026). rigzone.com (opens in a new tab)
- Gulf News — Oil prices split as Brent tops $102, Murban hits $110 (5 October 2026). gulfnews.com (opens in a new tab)
- Global Trading Outlook — IEA October oil market report: demand, diesel and stock releases (17 October 2026). globaltradingoutlook.com (opens in a new tab)
- The National — QatarEnergy turns to US LNG with Woodside deal as Hormuz force majeure drags on (29 October 2026). thenationalnews.com (opens in a new tab)
- Rigzone — EIA boosts oil price forecast by $5 in 2026, $10 in 2027 (8 October 2026). rigzone.com (opens in a new tab)
- Anadolu Agency — IEA members to accelerate release of 100M barrels as oil markets remain tight (16 October 2026). aa.com.tr (opens in a new tab)
- Kpler — Gulf states race to build Hormuz bypass infrastructure (10 July 2026). kpler.com (opens in a new tab)
- Al Jazeera — Hormuz ship attacks surge: are increased oil exports sustainable? (6 October 2026). aljazeera.com (opens in a new tab)
This article is for information only and is not investment, legal or trading advice. Figures are as reported by the sources cited on the date of publication.