خلاصه به فارسی
تنگه هرمز، میان ایران و عمان، پیش از جنگ ۲۰۲۶ نفتی معادل حدود یکپنجم مصرف جهانی و بیش از یکپنجم تجارت جهانی گاز طبیعی مایع (الانجی) را جابهجا میکرد. ایران حدود ۹۴ درصد صادرات نفت خام خود را از جزیره خارک در داخل خلیج فارس بارگیری میکند، در حالی که از پایانه جاسک در بیرون تنگه استفاده اندکی شده است. در این گزارش حجم جریانها، کشورهای وابسته به آن، تغییر جریانها، هزینه حمل و بیمه در سال ۲۰۲۶ و محدودیتهای مسیرهای جایگزین را بررسی میکنیم.
Key figures
- 94%share of Iran's crude exports loaded at Kharg Island in the 12 months to mid-March 2026.Kpler
- 11.4 Bcf/dLNG that passed through Hormuz in the first half of 2025, over 20% of global LNG trade, mainly from Qatar.EIA
- 30%share of global seaborne LPG exports that passed through the strait in 2025.Argus, citing Kpler
- 8.5 mb/dcrude exports through Hormuz in the week to 12 October 2026, nearly 40% below pre-war levels.Kpler, via Insurance Business
- 6–10%war-risk premiums as a share of hull value reported by brokers in October, against about 0.25% before the war.Insurance Business
How much energy passes through the Strait of Hormuz?
The Strait of Hormuz lies between Oman and Iran and connects the Persian Gulf with the Gulf of Oman and the Arabian Sea [2]. At its narrowest point it is 29 nautical miles (54 km) wide, with a 2-mile navigable channel in each direction and a 2-mile buffer zone between them [1].
Strait of Hormuz oil flows averaged 20.9 million barrels per day (mb/d) in the first half of 2025, according to the US Energy Information Administration (EIA). That was about 20% of global petroleum liquids consumption and a quarter of seaborne oil trade [2]. The International Energy Agency (IEA) estimates that the strait carried nearly 34% of global crude trade in 2025 [1].
Gas and other commodities matter too. In the first half of 2025, 11.4 billion cubic feet per day (Bcf/d) of liquefied natural gas (LNG) passed through the strait, over 20% of global LNG trade, mainly from Qatar [2]. About 93% of Qatar's and 96% of the UAE's LNG exports transit Hormuz [1]. Argus, citing Kpler, puts the strait's share of global seaborne liquefied petroleum gas (LPG) exports at about 30% [3]. The IEA adds that more than 30% of global urea trade, and about 20% of ammonia and phosphate trade, moves through the strait [4].
Which exporters and importers depend on Hormuz?
Six producers account for almost all of the oil. In 2025 the IEA put exports through the strait at 6.23 mb/d from Saudi Arabia, 3.63 mb/d from Iraq, 3.24 mb/d from the UAE, 2.41 mb/d from Iran, 2.37 mb/d from Kuwait and 1.43 mb/d from Qatar [1]. Of these, only Saudi Arabia and the UAE have operational crude pipelines that can bypass the strait. Iran, Iraq, Kuwait, Qatar and Bahrain rely on it for most of their oil exports [4].
On the import side, Asia dominates:
- Crude. About 89% of the crude and condensate that passed through Hormuz in the first half of 2025 went to Asia. China, India, Japan and South Korea together took 74% [2]. Europe received around 600,000 b/d, or 4% [1].
- LNG. China was the largest destination for LNG shipped through the strait, with almost a third of its LNG imports passing through it [2]. Bangladesh, India and Pakistan received almost two-thirds of their LNG via Hormuz [1].
- LPG. India imported about 21.5 million tonnes of LPG in 2025. More than 90% came from the Gulf, and 95% of that transited Hormuz [3].
How does Iran export its oil through Kharg and Jask?
Iran is a major resource holder. The EIA describes it as having some of the world's largest proved crude oil reserves and the second-largest natural gas reserves [5]. Its oil exports depend heavily on one terminal. The EIA describes Kharg Island as Iran's largest export terminal, handling most crude exports, with a reported maximum loading capacity of 7 mb/d [5].
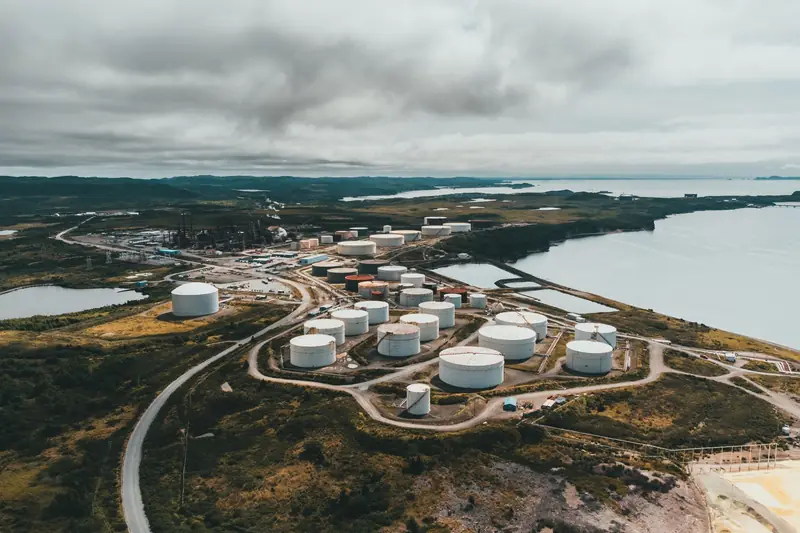
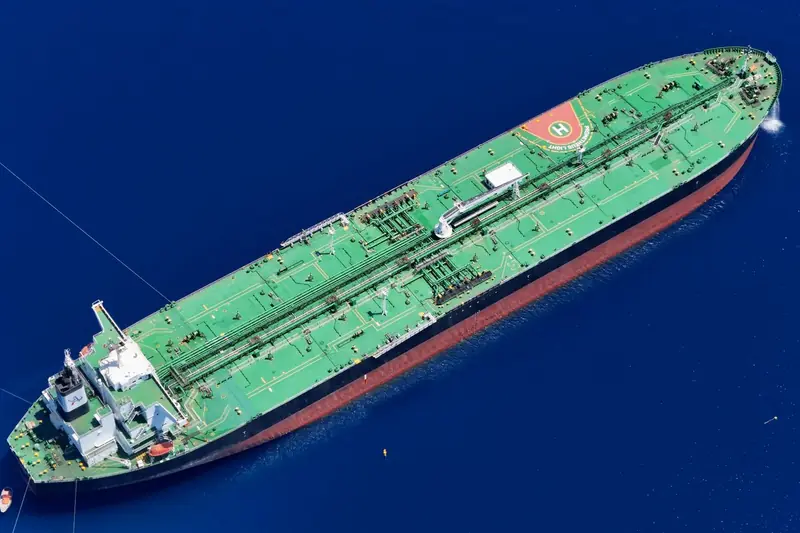
Kpler data show how concentrated this is. Over the 12 months to mid-March 2026, around 94% of Iran's crude exports were loaded at Kharg: about 1.52 mb/d out of national exports of 1.61 mb/d. Kharg has about 31 million barrels of storage, and very large crude carriers (VLCCs) can berth directly to load up to about 2 million barrels [6]. Iran's main buyer is China, where Iranian crude is discharged mainly at Shandong ports serving independent refiners [6]. In 2025 Iran also shipped 0.72 mb/d of refined products through the strait [1].
Iran's alternative to the strait is the Goreh–Jask pipeline to the Jask terminal on the Gulf of Oman. It was inaugurated in 2021 with a single export cargo, and the EIA puts its effective capacity at around 0.3 mb/d [2]. Kpler notes a design capacity of up to 1 mb/d and historically low use; a 2-million-barrel loading on 7 March 2026 was the first crude cargo from Jask since September 2024 [6]. The IEA regarded the route as effectively non-operational before the war [1].
How did the 2026 conflict change flows through Hormuz?
The war that began on 28 February cut flows sharply, and recovery has been partial and uneven.
- Oil. Using ship-to-ship transfers and alternative routes, Gulf crude exports reached 13.9 mb/d in September, more than 75% of pre-war levels [4]. Kpler data showed crude exports through Hormuz itself averaging about 8.5 mb/d in the week to 12 October, nearly 40% below pre-war levels [7]. Including the Red Sea and Gulf of Oman outlets, Kpler's seven-day average of Middle East oil flows was just over 24 mb/d around 20 October, above the pre-war average [8].
- Traffic. Lloyd's List Intelligence counted 104 transits by vessels not linked to Iran in the week of 5–11 October, including 81 tankers and gas carriers. US Central Command said 138 merchant vessels had been redirected under its blockade of Iranian ports, and Iran's Persian Gulf Strait Authority listed 124 ships as "non-compliant" [9].
- Iranian exports. The United States reinstated its blockade on 14 July. By the end of August, Kpler, Vortexa and TankerTrackers.com had recorded no Iranian crude cargo reaching China through the strait since then, and August exports had fallen to about 220,000–255,000 b/d [10].
- LNG. LNG supply from Qatar and the UAE fell by over 300 million cubic metres per day from 1 March, with around three-quarters of the loss offset by other suppliers. Qatar's Ras Laffan, the world's largest liquefaction facility, was shut after an attack on 2 March [4]. By 8 August seven of Qatar's 14 LNG trains showed activity, while two damaged trains are not expected back for at least several years [11]. Qatari LNG carriers resumed Hormuz transits on 28 September after a pause in August [12].
What has the conflict done to freight and insurance?
Insurance costs for the route have risen sharply. Before the war, war-risk premiums for tankers were about 0.25% of hull value. They were about 2% after the June memorandum between the United States and Iran, then rose to 7.5–10% in late July. Brokers recently quoted 6–10%, which can add up to $20 million to a single VLCC voyage into the Gulf [7]. The Lloyd's Market Association says cover remains available "for a price" [7].
Freight costs have also risen. The EIA reports that tanker rates reached record levels in September as ships took longer routes to avoid conflict zones [13]. Our review of Hormuz, Red Sea and Bosphorus chokepoint risk covers tanker rates and the Red Sea route in more detail.
What are the bypass options?
Large-scale bypass capacity exists only for crude oil, and only in Saudi Arabia and the UAE [4].
- Saudi East–West pipeline. Its design capacity is 5 mb/d. Aramco reported running it at 7 mb/d in March 2025, though sustained flows at that rate are untested [1]. Before attacks on the line, the EIA estimated it was carrying over 5.0 mb/d of exports via Yanbu on the Red Sea; flows were partly restored by 22 September [13].
- UAE Habshan–Fujairah pipeline (ADCOP). Built with 1.5 mb/d of capacity, it has been running at about 1.7–1.8 mb/d since hostilities began, according to reports [14]. A new pipeline of about 1.5 mb/d to Fujairah is due in 2027 and would double ADNOC's export capacity through the port [14]. The EIA describes the planned route as running from the Jebel Dhanna terminal to Fujairah [2].
- Limits. Before the war, the IEA estimated total spare bypass capacity at 3.5–5.5 mb/d, well below normal Hormuz flows [1]. Options for gas are narrower still: Oman's LNG export terminals run at close to full capacity, and the Dolphin gas pipeline has limited spare capacity [1]. In July, Energy Aspects expected Qatar to export 38.7 million tonnes of LNG in 2026, roughly half its pre-conflict capacity [15].
What to watch
- Diplomacy and the blockade. Brent eased to $114.51 on 26 October as Qatari mediators travelled to Tehran [16]. Any agreement would show first in Kharg loadings and tanker transits.
- LNG recovery. The number of Ras Laffan trains running and the pace of Qatari transits will drive Asian and European LNG supply.
- Bypass capacity. The reliability of the East–West pipeline and the timing of the new UAE line will set how much Gulf crude can avoid the strait in 2027.
- Insurance. War-risk rates are a direct signal of how shipowners judge the route.
Alupetra follows Hormuz flows and their effect on crude, LPG, LNG and urea markets as part of its market analysis, and does not deal with sanctioned persons, entities or vessels.
Sources
- IEA — Strait of Hormuz Factsheet (February 2026). iea.blob.core.windows.net (opens in a new tab)
- US EIA — World Oil Transit Chokepoints (updated 3 March 2026). eia.gov (opens in a new tab)
- Argus — Global LPG price response to the Iran war (Argus LPG World insight paper) (March 2026). view.argusmedia.com (opens in a new tab)
- IEA — The Middle East and Global Energy Markets (topic page, updated October 2026). iea.org (opens in a new tab)
- US EIA — Background Reference: Iran (updated 20 July 2021). eia.gov (opens in a new tab)
- Kpler — Explainer: Why Kharg Island is the backbone of Iran's oil economy (16 March 2026). kpler.com (opens in a new tab)
- Insurance Business — Hormuz sinking hands marine war underwriters another total loss as attacks surge (14 October 2026). insurancebusinessmag.com (opens in a new tab)
- Scripps News (CNN Wire) — Oil parked above $110 a barrel as IEA warns energy markets won't return to normal next year (20 October 2026). scrippsnews.com (opens in a new tab)
- Lloyd's List Intelligence — Strait of Hormuz Brief: 22 October, 2026 (22 October 2026). lloydslistintelligence.com (opens in a new tab)
- BusinessDay (Reuters) — Iran oil exports stall as blockade succeeds where sanctions failed (1 September 2026). businessday.co.za (opens in a new tab)
- Energy Connects (Bloomberg) — Qatar LNG loading jumps ahead of potential Hormuz reopening (11 August 2026). energyconnects.com (opens in a new tab)
- Egypt Oil & Gas (citing Reuters) — Qatar LNG cargoes resume Strait of Hormuz transits (6 October 2026). egyptoil-gas.com (opens in a new tab)
- US EIA — Short-Term Energy Outlook, Global oil markets (6 October 2026). eia.gov (opens in a new tab)
- The Maritime Executive — UAE instructs ADNOC to accelerate pipeline construction to bypass Hormuz (15 May 2026). maritime-executive.com (opens in a new tab)
- Energy Aspects — Qatar LNG: why Hormuz recovery will be slow and uneven (3 July 2026). energyaspects.com (opens in a new tab)
- Grafa — Oil Prices Fall 2% on Iran Talks, Brent Hits $114.51 (26 October 2026). grafa.com (opens in a new tab)
This article is for information only and is not investment, legal or trading advice. Figures are as reported by the sources cited on the date of publication.